พอดีตอนสอนหลักสูตรสร้าง iOS และ Android App ด้วย HTML5 มีหัวข้อน่าสนใจว่า ถ้าเราต้องการสร้าง Mobile application ด้วย HTML5 แต่อยากแสดงข้อมูลแบบ Chart (พวกกราฟแท่ง หรือกราฟเส้น) จะทำได้ยังไง
คำถามน่าสนใจไหมล่ะ? 🙂
ถ้าเข้าใจแนวคิดของ PhoneGap และ Cordova แล้ว คำถามนี้ไม่ยากเลย นั่นคือเราสามารถหา Chart framework ที่เป็น Web Chart (พวกเดียวกับที่เราใช้บน Web application) ใช้งาน
เพียงแต่ Web Chart นั้นต้องไม่อ้วน เทอะทะ กินทรัพยากร กินแรมบนเครื่อง ซึ่งผมก็ลองหา และรวบรวมมาให้ลองเอาไปใช้กันในที่นี้
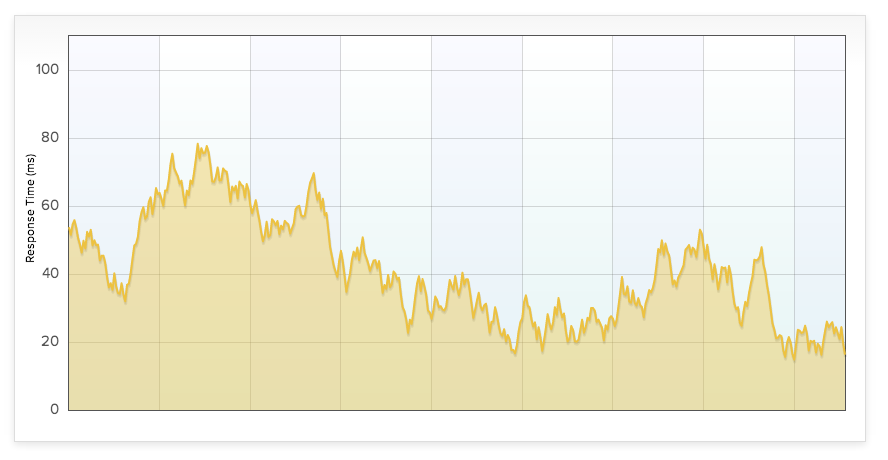
Flot (ฟรี)
Chart plugin เรียกใช้งานได้ผ่าน JQuery และเป็นตัวที่นักพัฒนา HTML5 Application หลายคนนิยม
เข้าไปดูวิธีใช้งานและ Download จากที่นี่

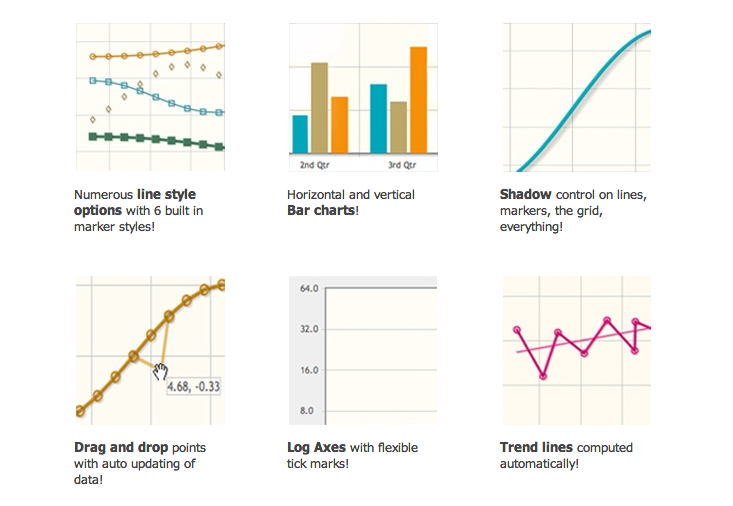
JQPlot (free)
Another chart plugin for JQuery

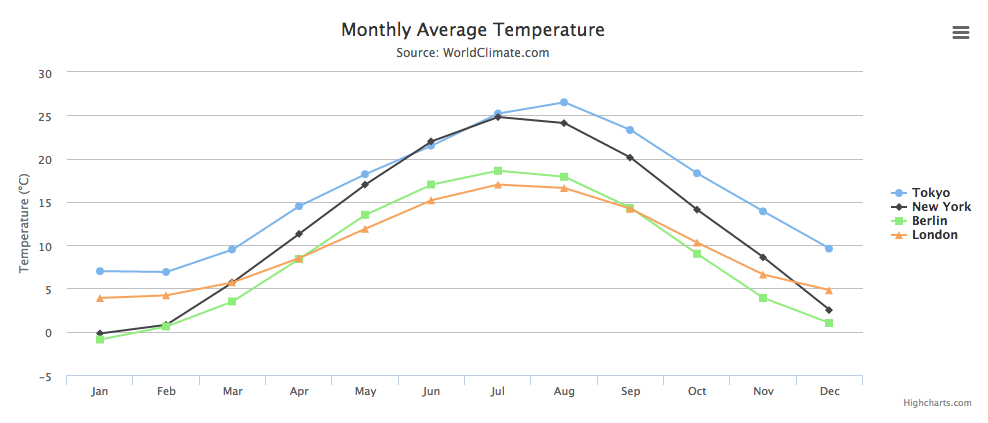
Highcharts (Free/Paid)
Hightcharts claims that their engine optimize and work well on mobile web browser. So it is a good choice if you are planning to visualize data on mobile phone or tablet.

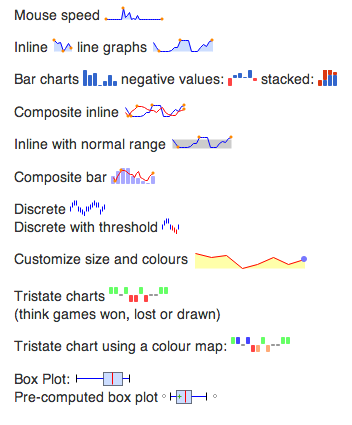
JQuery Sparkline (free)
You may need to show just tiny graph and chart, following behind your data. Sparkline is your best choice.

ZoomChart (Paid)
One of the powerful web chart I’ve tried. Optimized for mobile web application. Its high price may keep you away from this tools, but I encourage you to try their feature before make decision

Reference – StackOverflow